Time Log Teams – time spent on other Teams’ sites (must have 3 entries or more):
Date: Mar. 02, 2026 From: 06:18pm To: 06:33pm
Date: Mar. 03, 2026 From: 09:02pm To: 09:17pm
Date: Mar. 04, 2026 From: 08:26pm To: 08:41pm
Date: Mar. 05, 2026 From: 07:52pm To: 08:07pm

Time Log Students – time spent on other students’ sites (must have 3 entries or more):
Date: Mar. 02, 2026 From: 07:12pm To: 07:27pm
Date: Mar. 03, 2026 From: 08:41pm To: 08:56pm
Date: Mar. 04, 2026 From: 09:13pm To: 09:28pm
Date: Mar. 05, 2026 From: 07:52pm To: 08:07pm
Date: Mar. 06, 2026 From: 10:08pm To: 10:23pm
Essay I. Summary of your activities in your contents including new contents created (one paragraph). Provide all the hyperlinks (clickable) of new contents you have created this week.
This week, I created and published two new analytics/statistics-focused content pieces that explain core probability concepts in a practical and accessible way. The first post covers Bayes Theorem, focusing on how evidence can update probabilities and support better business decision-making, while the second post compares Poisson vs. Binomial distributions, clarifying when each distribution should be used and how they differ in real-world problem settings. Together, these posts strengthen the educational value of my content by translating foundational statistical theory into applied insights for data analysis and business contexts.
Bayes Theorem: http://13.52.17.154/2026/03/05/bayes-theorem-understanding-business-outcomes-with-evidence/
Poisson vs Binomial Distribution: http://13.52.17.154/2026/03/05/probability-distributions-poisson-vs-binomial-distribution/
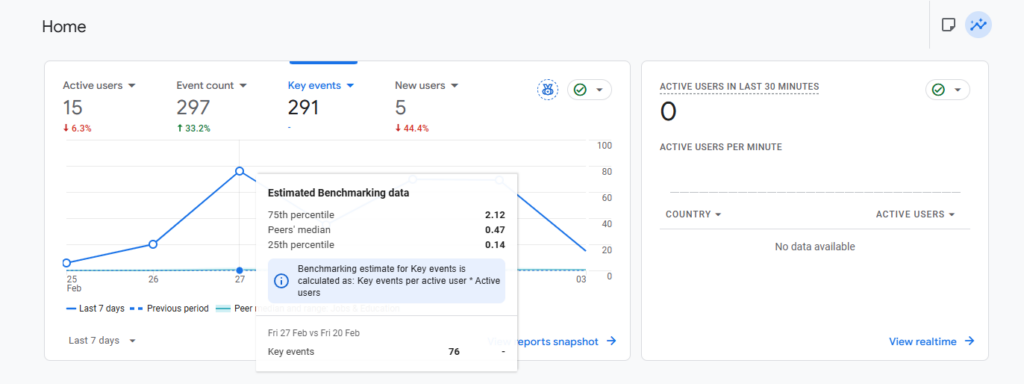
Essay II. Summary/analysis of your ‘automated insights’ (add screenshots) (one paragraph)
In my GA4 Home dashboard, the automated insights/benchmarking view highlights how my recent performance compares to peers and helps me quickly interpret whether activity is strong or weak without building a custom report. From the screenshot, key events are 291 for the selected period, and the tooltip shows benchmarking estimates for key events per active user (with a 75th percentile of 2.12, peers’ median of 0.47, and 25th percentile of 0.14), which indicates GA4 is automatically contextualizing my engagement quality rather than only showing raw counts.
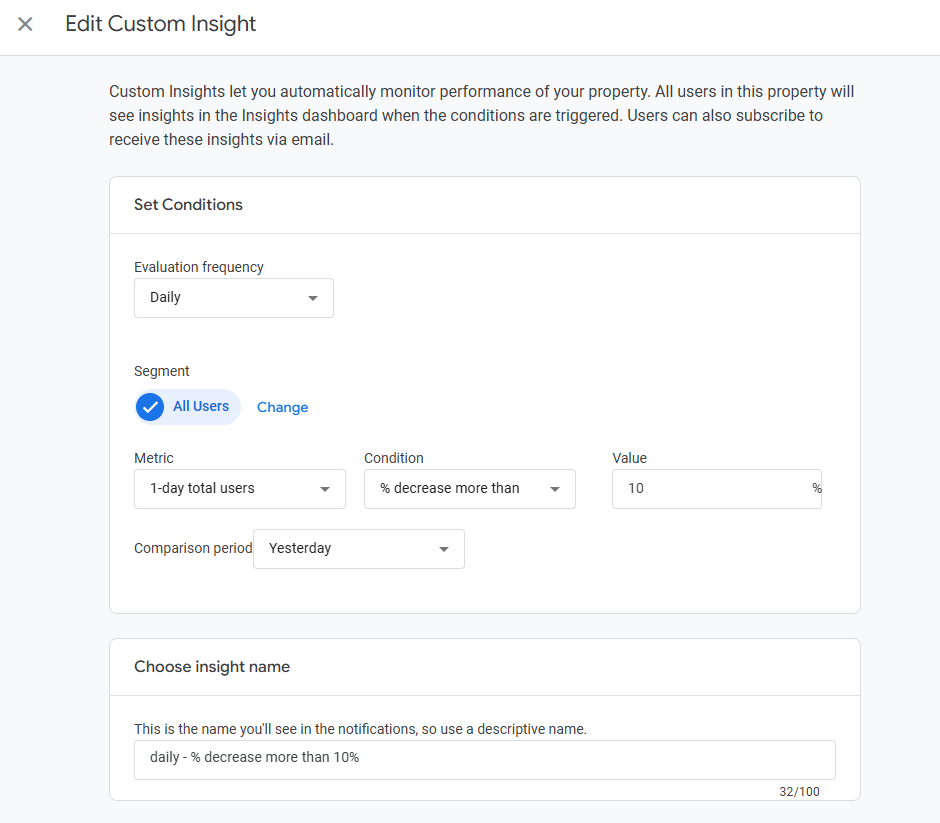
Essay III. Summary/analysis of your ‘custom insights’ (add screenshots) (one paragraph)
I expect this custom insight to automatically alert me when daily total users drop by more than 10% compared with the previous day. This helps us quickly identify unusual declines in traffic, monitor overall site performance, and investigate potential causes such as tracking issues, website problems, campaign changes, or shifts in user behavior.